
Digital Transformation
Navigating the Digital Transformation Journey: A Guide for Construction Professionals
BLOG The construction industry, long tethered to traditional methods, is
This includes:
Standardisation of naming packages and locations
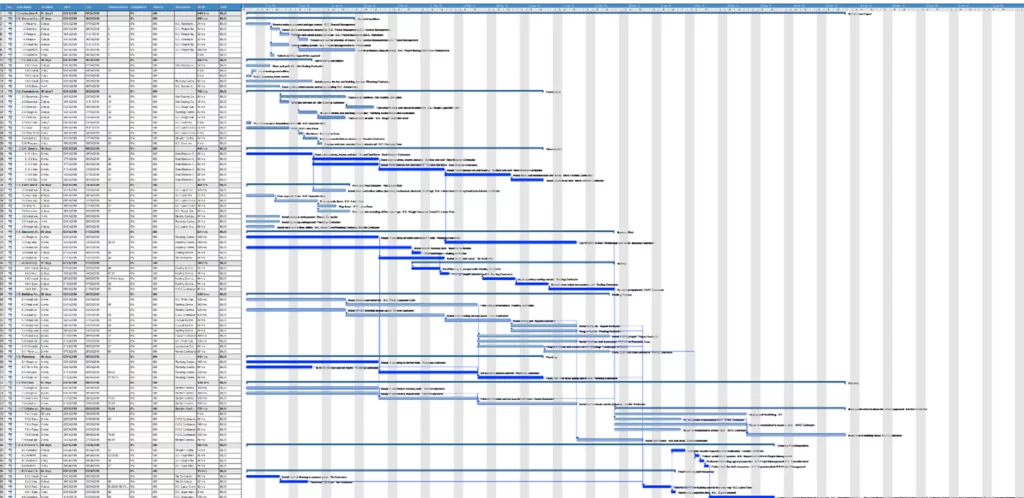
Developing the project program/schedule
Typical data model for the schedule export
Last Planner process
Capturing the progress of work activities
Producing a comprehensive program for your project is a challenging task and takes considerable time to develop. There are many complex factors and assumptions that must be considered when developing a construction program for a project. This requires experience and deep knowledge of the project to accurately predict how it will be executed. For this reason, people typically invest a lot of time and effort in developing programs during pre-construction. However, during construction, the management of the program is typically pushed onto a lone scheduler who is required to track and update the schedule in isolation. Most large construction projects are far too complex and broad for a single person to know everything that is going on. The tracking of progress should be a shared responsibility for the entire project team to tackle in a collaborative and transparent way. Processes should be put in place to enable the straightforward capture and recording of day-to-day activities to facilitate the updating of the program and progress reporting. This should also be the responsibility of all teams so they take ownership of the planning and executing of their work activities. If this is done collectively across the project all teams will benefit from this shared knowledge, and thus can better plan out and execute their work activities. This requires good management and communication processes to be implemented to enhance collaboration and the effective sharing of information between the project teams, I discussed this in detail in my previous blog on effective project reporting, so won’t go into that here.
When developing the construction program you must first have a good understanding of the scope, construction methodology and the many complex interdependencies required to execute the project.
Developing the program in line with the project Information Management Plan IMP and with good naming conventions is critical to enable the flow of data into and out of the schedule. The naming of Packages, Zones / Areas / Rooms should be standardised across the project. This should be defined in detail within the IMP and enforced by the project management to ensure compliance.
To facilitate the flow of data from the program during export, additional custom columns should be added for zones, areas, packages or any other important project parameter that you require. This provides each task with important metadata to enable the easy categorisation of tasks when exported into data tables. If this is done correctly in a structured and standard way data can easily be shared between project partners and leveraged to simplify a data-driven approach to project reporting.
The sharing of structured data between project departments improves:
Project flow and performance
Easy comparison between work done and value spent (Schedule / Commercial)
4D planning connecting 3D models with program data
Facilitate Lean and TAKT planning processes
Improved logistics
To leverage the construction schedule information effectively you will need to be able to export the schedule from the native software into excel, csv or SQL database, the process of this will depend on the software platform you are using. All major scheduling software platforms support this option in some form. To standardise the export and make it repeatable, you will need to set up a dedicated export view with defined columns that can be exported into a standard table format. It’s critical that the table structure is standardised and repeated every time the schedule is exported.
If you have set up your programme correctly with the custom columns described above you will be able to categorise all the work activities easily and build relationships with other tables such as your procurement schedule (Work Packages), schedule of areas and any other relevant list or table used to manage your project. It is this process of categorising and building relationships between other databases that enables you to leverage the information within the schedule effectively to support a data-driven approach to your project management reporting.
Ideally, if you have a well-structured program that exports into a good clean data table you will be able to do all your data modelling within Power BI. You can provide additional metadata to the activities within excel if required, but care should be taken to ensure this is an agile and dynamic process as you can run into issues very quickly if tasks are added or removed from the construction program, which typically does happen as the project progresses. Power BI is a great tool for connecting multiple data sources in various formats together. It allows you to build communication between the data tables which is referred to as data modelling. If you invest the time during the data modelling stage to build a clean robust data model, it will make the development of all follow on reports easier. This enables the development of impactful reports that provide good insights and versatility for the project management team.
The main challenge during construction is updating live progress as it occurs out in the field. This should be the responsibility of the entire project team and incorporated within daily, weekly and monthly progress reporting workshops. The Last Planner System is a great process for managing work activities out in the field. It is also a great tool for capturing what is actually happening on the site on a daily and weekly basis and involves all trades. The Last Planner System greatly enhances the flow of a project through collaborative planning, which allows workers on the job to plan their work together, rather than by a few in a vacuum and address issues together before they inhibit the natural flow of work.
Traditionally this has been captured using whiteboards and notice boards on-site in large control rooms. In recent times, however, there has been an influx of software tools used to make this process smooth and capture the day-to-day activity information in a digital format. If this is structured correctly in line with the project information standards, the information can be easily leveraged in line with other data sources like the construction programme, procurement schedule and quality requirements. The valuable aspect to note here is the Last Planner System is a people-driven process with the technology used to facilitate it, not the other way around. This is about communication, collaboration and working together for the shared benefit of the entire project.
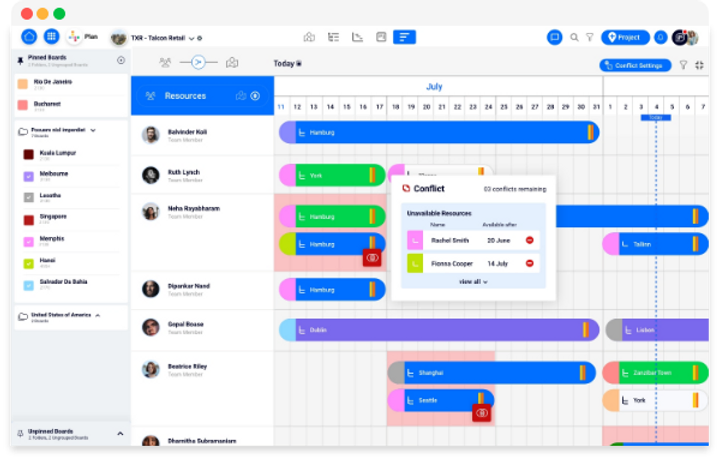
WayLoader is a geospatial collaboration tool for construction projects. Plan is one of the key modules within WayLoader and is focused on managing project work activities in a shared collaborative environment. The key to the success of this software is that it focuses on communication and collaboration between the entire project team, with the Lean Last Planner processes built in.
The Last Planner System focus on four conversations around;
What Should Occur (Overall Project Program)
What Can Occur (Constraints Log)
What Will Occur (Committed Tasks)
What Did Occur (Progress Updates)
Capturing this information is key to maintaining flow in your project and unlocking constraints to maximise production rates across all trades. Additionally capturing this information in a digital format from the use of platforms such as WayLoader is critical to unlocking live project reporting.
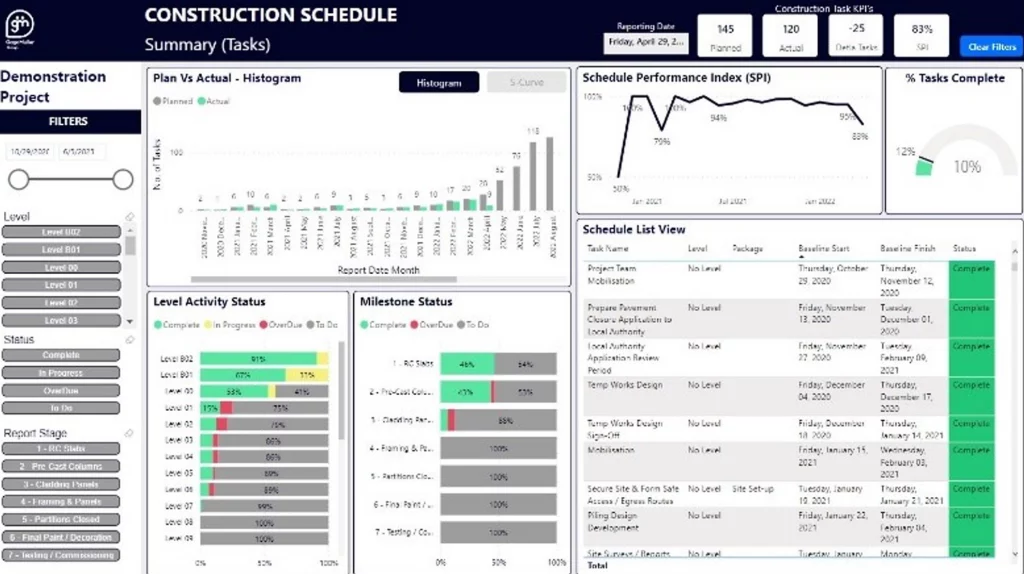
Once all the project management processes have been standardised and optimised to improve the flow of data and sharing of information between various disciplines. The Data can then be imported into Business Analytics tools like Power BI. Power BI is a great platform that lets you connect to multiple data sources, build large data models and can handle large volumes of data. Power BI can be a challenging software to get to grips with but is a great tool to visualise your data and to unlock meaningful insights
When building your report, you should consider your audience and usability to find the balance between providing enough information and not overcrowding the dashboard with irrelevant data. In these sample dashboards below, we have grouped and categorised the data to provide high-level metrics on project performance, with filters that allow the user to drill down into specific zones or packages as well. This allows the users to customise the report for their own specific needs as required.
Capturing live construction progress along with project constraints, risks, and opportunities and feeding this information into overall project reports provide valuable information and insights. These reports can empower stakeholders to make timely decisions to mitigate issues on the project.
The use of data visualisation tools such as Power BI to bring business analytics to construction reporting is very powerful, especially if the original data sources are built on good information management practices, as discussed above.
If you want to incorporate a data-driven approach to how you manage your projects, get in contact with our project management team.
To hear more about how WayLoader can help you capture live project progress in a collaborative environment, contact our sales team.
BLOG The construction industry, long tethered to traditional methods, is

BLOG The construction industry is notorious for being capital-intensive and

BLOG This blog is going to discuss how you can
Apply Now

Apply Now